


 Advanced Modeling
Malloy Notebooks (.malloynb files) combine queries, results, and documentation in a single interactive document. They're the best way to explore data, build analyses, and share findings.
What Is a Malloy Notebook?
A notebook is a file with alternating cells of:
Markdown - Text, headings, explanations
Malloy code - Model definitions, queries
When you run a notebook, each code cell executes and displays results inline. The document becomes a living report.
This entire documentation website is built from .malloynb files—interweaving markdown with actual running Malloy code blocks.
Creating a Notebook
1. Create the File
In VS Code, create a new file with the .malloynb extension:
File → New File → sales_analysis.malloynb2. Add Cells
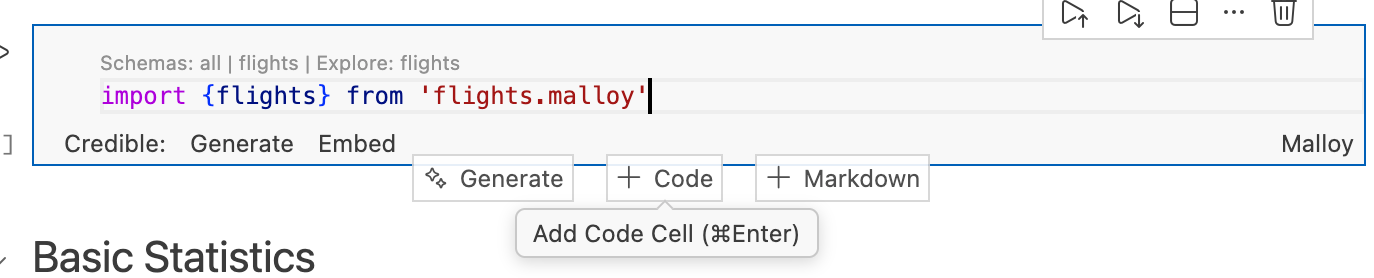
Click + Code or + Markdown to add new cells to your notebook.
Under the hood, .malloynb files are plain text with cell markers (>>>markdown or >>>malloy), so they're easy to diff and version control.
3. Run the Notebook
Click Run All at the top of the VS Code editor, or run individual cells by clicking the play button next to each one.
Use Cases
Static Dashboards
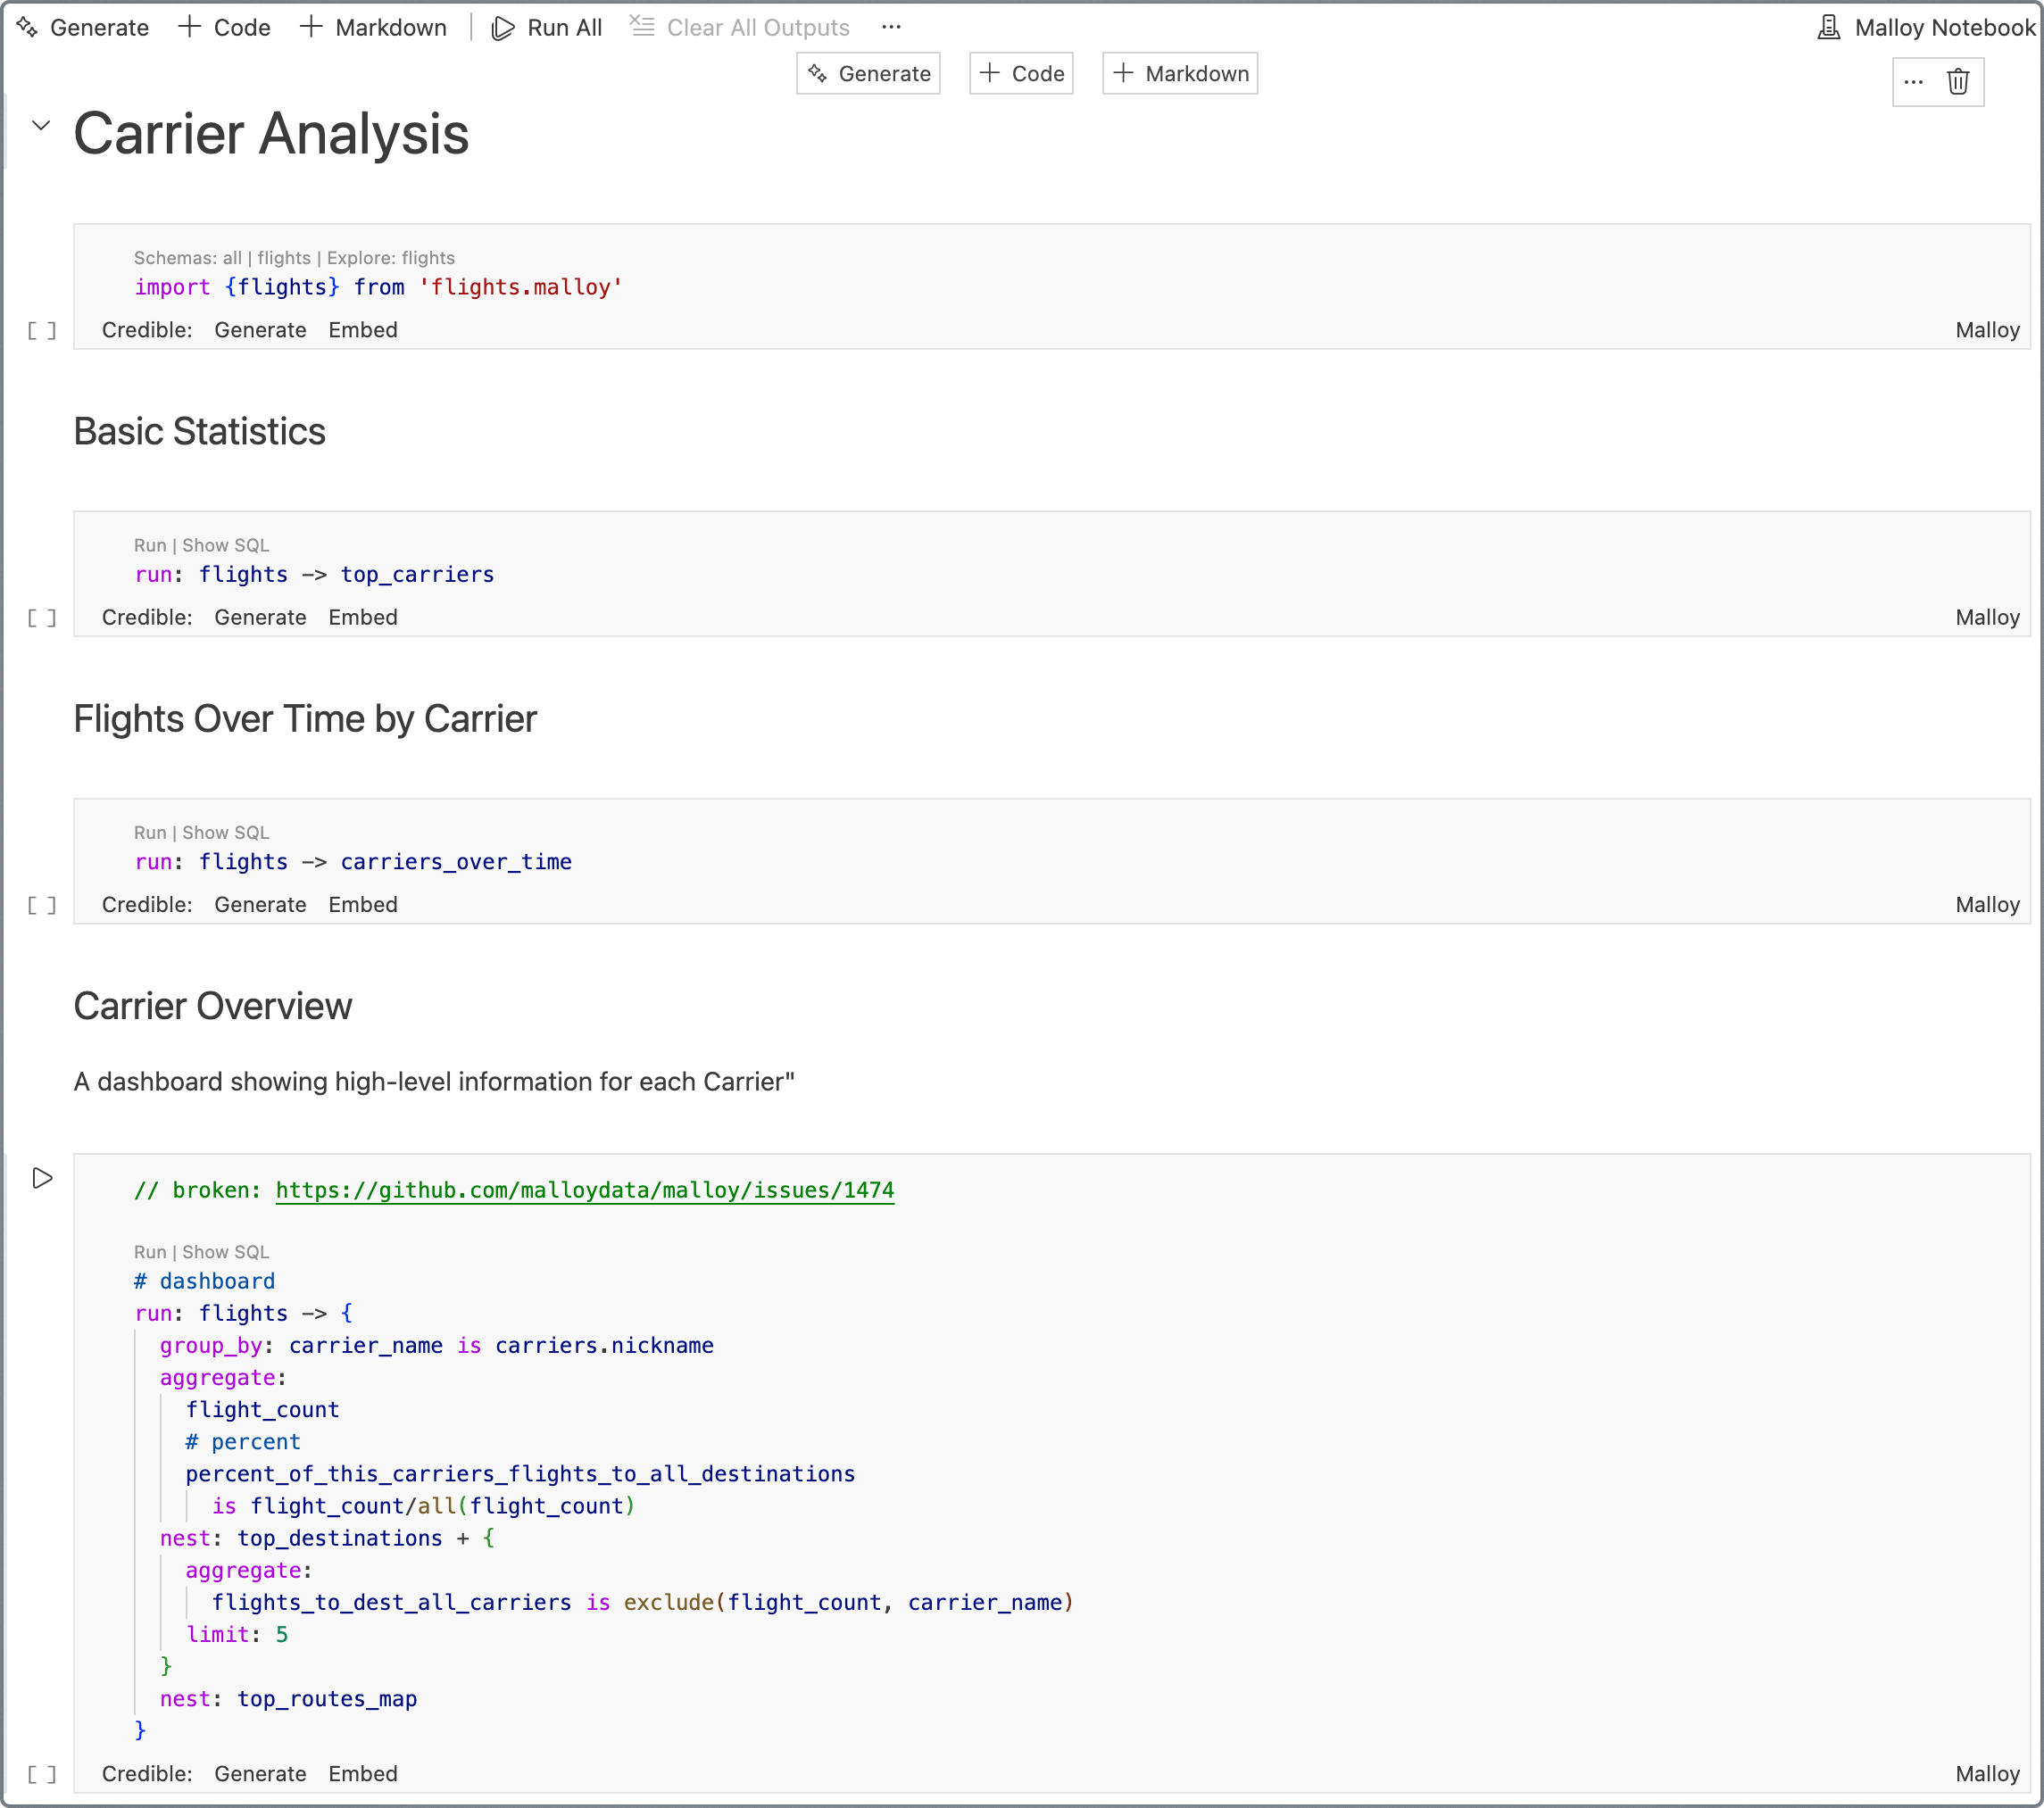
Notebooks render code blocks with descriptions. They can render any Malloy visualization—dashboards, charts, tables. Readers can inspect the code used to generate them.
Data Stories
From EDA and high-level statistics to detailed drill-down, notebooks show the flow of analysis. Use them to document your analytical journey and share insights with others.
When published via Publisher, notebooks become read-only—great for dashboards and reports.
Example Notebooks
See these notebooks for inspiration:
Names Analysis - Exploring baby name trends
Carrier Analysis - Flight carrier performance
Auto Recalls - Example of starting with an import
Tip: Press . on any GitHub page to open it in github.dev (VS Code in the browser).
Importing Models
A typical notebook starts with an import cell followed by one or more query cells.
Cell 1 — Import your model:

import "flights.malloy"Cell 2 — Query using sources from that model:
run: flights -> {
  aggregate: flight_count
  nest: by_carrier is {
    group_by: carrier
    aggregate: flight_count
    limit: 5
  }
}
[
  {
    "flight_count": 344827,
    "by_carrier": [
      {
        "carrier": "WN",
        "flight_count": 88751
      },
      {
        "carrier": "US",
        "flight_count": 37683
      },
      {
        "carrier": "AA",
        "flight_count": 34577
      },
      {
        "carrier": "NW",
        "flight_count": 33580
      },
      {
        "carrier": "UA",
        "flight_count": 32757
      }
    ]
  }
]
WITH __stage0 AS (
  SELECT
    group_set,
    CASE WHEN group_set=0 THEN
      COUNT(1)
      END as "flight_count__0",
    CASE WHEN group_set=1 THEN
      base."carrier"
      END as "carrier__1",
    CASE WHEN group_set=1 THEN
      COUNT(1)
      END as "flight_count__1"
  FROM '../../documentation/data/flights.parquet' as base
  CROSS JOIN (SELECT UNNEST(GENERATE_SERIES(0,1,1)) as group_set  ) as group_set
  GROUP BY 1,3
)
, __stage1 AS (
  SELECT
    *,
   CASE WHEN GROUP_SET=1 THEN
                 ROW_NUMBER() OVER (PARTITION BY group_set ORDER BY  "flight_count__1" desc) END  as __row_number__1
  FROM __stage0
)
, __stage2 AS (
  SELECT * FROM __stage1
   WHERE  NOT ((GROUP_SET = 1 AND __row_number__1 > 5))
)
SELECT
  MAX(CASE WHEN group_set=0 THEN "flight_count__0" END) as "flight_count",
  COALESCE(LIST({
    "carrier": "carrier__1",
    "flight_count": "flight_count__1"}  ORDER BY  "flight_count__1" DESC NULLS LAST) FILTER (WHERE group_set=1),[]) as "by_carrier"
FROM __stage2
This keeps your semantic model separate from analysis notebooks.
Publishing Notebooks
Notebooks can be deployed via Publisher alongside your semantic models. Published notebooks:
Render as browsable HTML reports
Include live query results
Can be shared via URL
To publish, include .malloynb files in your package alongside .malloy models:
my-analytics/
├── publisher.json
├── models/
│   └── orders.malloy
└── notebooks/
    └── monthly_report.malloynb
Interactive Filters
Notebooks can expose interactive filter controls that let viewers narrow query results dynamically. When a user changes a filter value, Publisher rewrites each query with a where: clause on the server and re-executes the affected cells.
Note: Interactive filters are rendered when viewing notebooks via Publisher or the Publisher SDK. They are not currently displayed in VS Code—that capability is coming soon.
How It Works
Filters are declared on the source using #(filter) annotations. Publisher parses these annotations, exposes filter metadata through its API, renders widgets above the notebook, and injects matching where: clauses into queries at execution time. Any notebook that imports the source automatically inherits its filters—no notebook-level configuration is required.
Declaring Filters
Place one or more #(filter) annotations immediately above a source definition:
#(filter) name=Manufacturer dimension=Manufacturer type=in
#(filter) name=Subject dimension=Subject type=like
#(filter) name=Major_Recall dimension="Major Recall" type=equal
#(filter) name=Recall_After dimension="Report Received Date" type=greater_than
#(filter) name=Recall_Before dimension="Report Received Date" type=less_than
source: recalls is duckdb.table('data/auto_recalls.csv') extend {
  measure:
    recall_count is count()
}
Annotation Syntax
#(filter) [name=NAME] dimension=DIMENSION type=TYPE [implicit] [required]| Parameter | Required | Description |
|---|---|---|
name |
No | Unique identifier for the filter, used as the API parameter key. Defaults to the dimension name. |
dimension |
Yes | The dimension the filter targets. Quote with "..." if it contains spaces. |
type |
Yes | Comparator type (see below). |
implicit |
No | Flag. Hides the filter from the UI and API summaries—useful for row-level security. |
required |
No | Flag. The server returns a 400 error if a required filter has no value at query time. |
Filter Types
| Type | Malloy Clause | Use Case |
|---|---|---|
equal |
dimension = 'value' |
Exact match on a single value |
in |
dimension ? 'a' | 'b' | 'c' |
Match any of multiple values |
like |
dimension ~ '%value%' |
Substring / pattern matching |
greater_than |
dimension > value |
Range filter (after, minimum) |
less_than |
dimension < value |
Range filter (before, maximum) |
Multiple Filters on the Same Dimension
Give each filter a unique name to declare multiple controls over the same dimension. This is the standard pattern for date ranges:
#(filter) name=Start_Date dimension="Created At" type=greater_than
#(filter) name=End_Date dimension="Created At" type=less_than
Each filter operates independently and maps to its own API parameter.
Widget Rendering
Publisher selects the widget type based on the underlying dimension's Malloy data type:
| Dimension Type | Widget |
|---|---|
string (with in or like) |
Searchable multi-select or text input |
boolean |
Toggle / dropdown |
date / timestamp |
Date picker |
number |
Numeric input |
Implicit filters are hidden from the UI but still applied server-side.
Custom Labels
By default, filter widgets display the dimension name. Use the # label="..." annotation on the dimension to customize it:
source: recalls is duckdb.table('data/recalls.csv') extend {
  dimension:
    # label="Vehicle Manufacturer"
    Manufacturer is Manufacturer_old
}
Example
See the Auto Recalls notebook for a working example of interactive filters.
For the full specification—including API details, bypass filters, and MCP tool integration—see the Publisher filter documentation.
Tips
Start simple - Begin with a basic source, run a query, then add complexity.
Use markdown liberally - Document your analysis as you go. Future you will thank present you.
Keep models separate - For reusable logic, put it in a .malloy file and import it into notebooks.
Run cells individually - When debugging, run one cell at a time to isolate issues.
Next Steps
Building Semantic Models - Deep dive into Malloy modeling
Publishing Models - Deploy your work
Malloy in Jupyter - Use Malloy in Jupyter notebooks